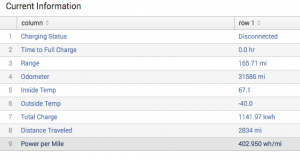
With the upgrade to the Model S firmware recently I lost my way of figuring out what my car’s milage is. I used to just use the “Trips” App on the left side of my console to show my Wh per mile and since I never reset my trips would show a count of how much power I’ve used, how far I’ve gone, and my fuel (er… electric) economy. But after the update Tesla changed the app and only shows this per charge….
At the same time, I was looking for things to do with my personal Splunk instance that I have. A late night epiphany showed me that I can simply use the car’s API to dump data into Splunk. I can then use Splunk to query the data and create a dashboard from it
So, the first step is to get the data into Splunk. The more often I collect the data the more accurate it is… A 30 minute collection interval will miss trips to the store and skew my average speed. But a 1 minute collection interval may piss off Tesla and they might ban my API usage. I settled on 15 minutes. I can always increase it later. I also chose to give this its own index in Splunk. If I want to kill it, I can easily kill an index and leave the rest of my data intact. Plus I’m not going to search this data and my other data at the same time. Firewall logs and tesla API data won’t ever be in the same search, so I won’t gain performance by keeping it with any of my other data.
The next question was what data I wanted to collect… The API is documented here http://docs.timdorr.apiary.io/# . I chose to collect all the different data types
- Vehicle State
- Climate State
- Drive State
- Charge State
As you can see from the picture above, the climate state is a bit flaky and requires the car to be on for it to work. I figured that I can collect it now and when I figured out what to do with it at least I’ll have a lot of data to work with. The collected data looks like:
2015-11-27T20:00:01Z charge_state charging_state=“Disconnected” charge_limit_soc=“80” charge_limit_soc_std=“90” charge_limit_soc_min=“50” charge_limit_soc_max=“100” charge_to_max_range=“false” battery_heater_on=“” not_enough_power_to_heat=“” max_range_charge_counter=“0” fast_charger_present=“false” fast_charger_type=“<invalid>” battery_range=“165.71” est_battery_range=“142.66” ideal_battery_range=“191.7” battery_level=“68” usable_battery_level=“68” battery_current=“–1000.0” charge_energy_added=“42.32” charge_miles_added_rated=“143.5” charge_miles_added_ideal=“166.0” charger_voltage=“” charger_pilot_current=“” charger_actual_current=“” charger_power=“” time_to_full_charge=“0.0” trip_charging=“” charge_rate=“0.0” charge_port_door_open=“” motorized_charge_port=“false” scheduled_charging_start_time=“” scheduled_charging_pending=“false” user_charge_enable_request=“” charge_enable_request=“true” eu_vehicle=“false” charger_phases=“”
Since knowing how many miles the car can drive on a charge is important I can use the above data to create a graph of my range over time:
That graph was produced with this search:
index=”tesladata” charge_state | timechart avg(battery_range)
Changing the time range from all time down to a week will give me great views on how I use my battery.
Leveraging the drive_state API, I get data that looks like:
2015-11-27T20:15:01Z drive_state shift_state=“” speed=“” latitude=“40.000000” longitude=“–74.000000” heading=“306” gps_as_of=“1448655348″
I can then use the GPS functions of Splunk to plot out where my car has been over time:
index=”tesladata” drive_state | geostats latfield=latitude longfield=longitude count
It would be really cool if Splunk were able to plot all the events to show the routes I’ve driven but Splunk can’t do that today.
The script I used for this is below. Please note I removed the authentication bits from the script
#!/usr/bin/ruby
$:.unshift File.dirname(__FILE__)
require "tesla_api"
require "time"
t = TeslaApi::Client.new(...snip...)
t.login!(...snip...)
car = t.vehicles.first
print Time.now.utc.iso8601
print " charge_state"
car.charge_state.each do | key, val |
print " #{key}=\"#{val}\""
end
puts
print Time.now.utc.iso8601
print " climate_state"
car.climate_state.each do | key, val |
print " #{key}=\"#{val}\""
end
puts
print Time.now.utc.iso8601
print " drive_state"
car.drive_state.each do | key, val |
print " #{key}=\"#{val}\""
end
puts
print Time.now.utc.iso8601
print " vehicle_state"
car.vehicle_state.each do | key, val |
print " #{key}=\"#{val}\""
end
puts
Its pretty simple code. Each event needs a timestamp and gets a key to identify the type of line it is. The rest is the output of each field the particular API returns. By using key=value in the event I allow Splunk to automatically create fields from the keys making it easier to run searches on later.
I run the script from within Splunk by updating inputs.conf:
[script://$SPLUNK_HOME/etc/apps/search/bin/get_tesla_info.rb]

disabled = false

host = teslamotors.com

index = tesladata

interval = 900

sourcetype = tesla_car_info
I set the host to teslamotors.com instead of my indexer. I think it is cleaner that way. I also give it a source type to differentiate it from my other data and let me do mangling to it if I need to.

